Latest Stories
Documentation
Stats : Performance Overview and Filters
Performance Overview

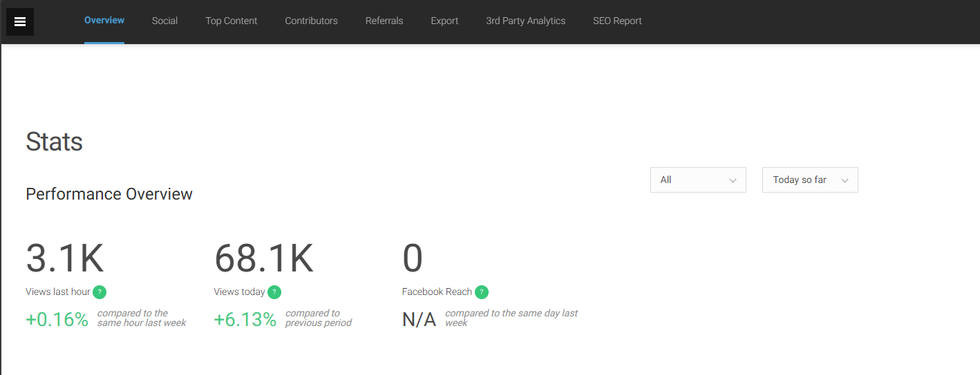
RebelMouse's performance overview on the Stats Dashboard provides a comparison of key metrics over time, enabling a quick assessment of content performance.
In the default "Today so far" view, statistics are compared to the same timeframe from the previous week, rather than the previous day, offering a more accurate comparison under similar conditions. You can also adjust filters to focus on specific sections or timeframes:
- Views Last Hour: This metric compares the views in the current hour with the same hour on the same day the previous week.
- Views Compared to Prior Time Period: Displays views relative to a previous period of the same duration.
- Facebook Reach: This shows the total number of users reached through your Facebook page content. Data for Facebook Reach is only available for 24-hour periods or longer and cannot be filtered by specific sections.
Filters

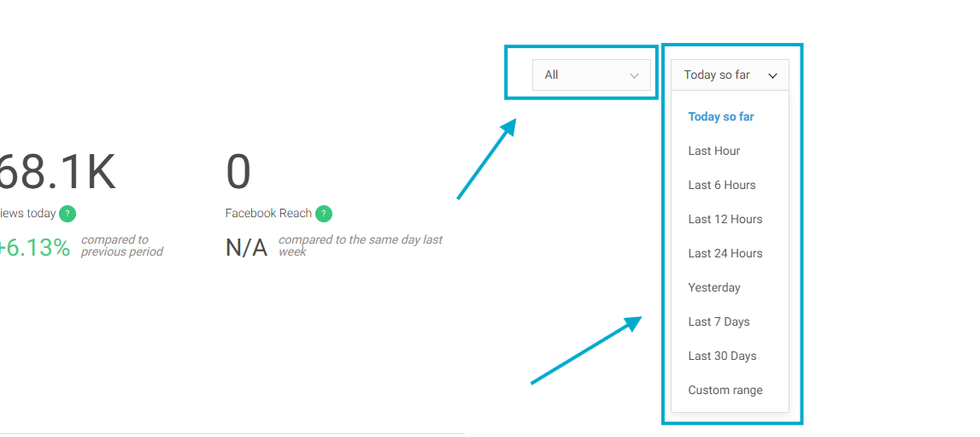
You can filter all the Data of your site by 2 columns: Sections and Time Frame.
The Sections filter, which by default has the “All” value, will show all the sections created on your site once the dropdown is clicked.
The Time filter, which by default has the “Today so far” value, can also show the following time frames:
- Today so far: gets the data since 12 A.M. from the current day
- Last Hour
- Last 6 Hours
- Last 12 Hours
- Last 24 Hours
- Yesterday: previous 24 Hours
- Last 7 Days
- Last 30 Days
- Custom Range: Allows you to select any time frame between a 90 Day period (3 months back).
Table of Contents
© 2026 RebelMouse. All rights reserved.
Comments Moderation Tools