

This article was originally posted on the Chartbeat blog. Chartbeat’s real-time content analytics, historical dashboards, and optimization tools help the world’s leading media organizations understand, measure, and build business value from their content.
Publishers have always had to weigh the risks and rewards of quick news bulletins and deeply-reported longreads. Write too much and you might lose readers who are just looking for the facts. Write too little and you might cut the sections that turn those casual visitors into loyal readers.
While striking this balance is the responsibility of a good editor, one of our responsibilities is to uncover data and insights that make those decisions easier. It’s in that spirit that our Data Science team recently investigated the relationship between word count and engagement.
We sought to find out how Average Engaged Time changes as word count increases and how editorial teams can use this data to optimize their content. More on those findings below.
Average Engaged Time Increases With Word Count, up to a Point
In the undertaking of this study, Chartbeat’s data scientists analyzed millions of articles of 10,000 words or fewer that were published between January 2019 and April 2022. With a global network of publishers, languages, and grammar rules in the same dataset, this was not as simple as scraping HTML and calculating engaged time, but our team was up to the challenge and delivered a trove of data illuminating the relationship between article length and engagement.
 Chartbeat
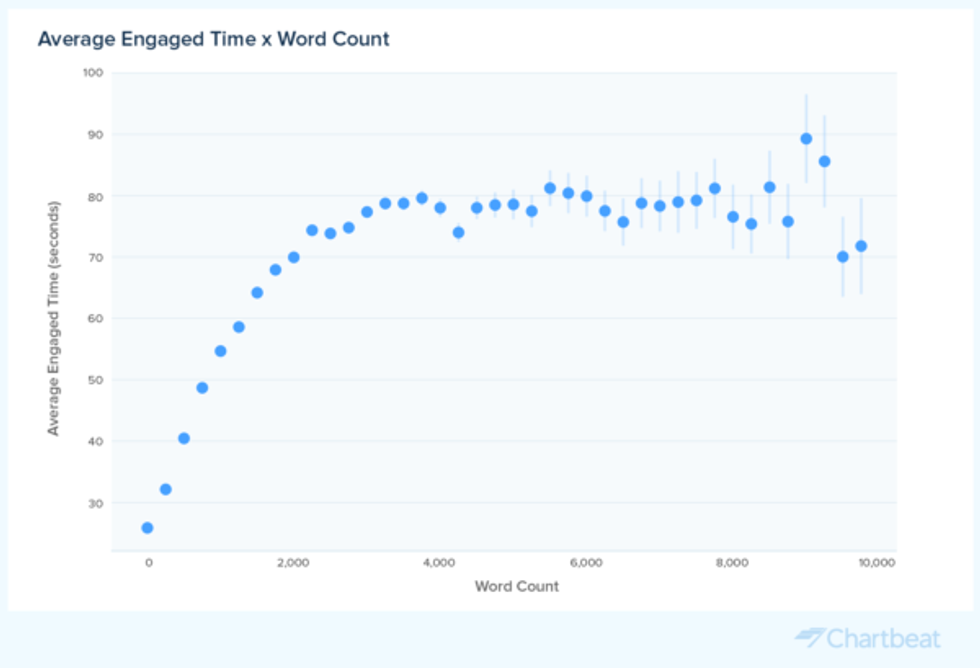
When we plot Average Engaged Time by word count, two clear patterns emerge:
- Between 0 and 2,000 words, Average Engaged Time increases as word count increases.
- Once word count grows beyond 4,000, the variability in engaged time also grows, and the return on additional length is less certain.
In other words, we can confidently say that for articles of less than 4,000 words, the longer the article, the more engaging it will be. Beyond 4,000 words, however, the interval of expected engaged time varies much more widely, and we can no longer conclude that engaged time will increase with word count.
While this doesn’t mean that there is no more engagement to be had beyond this point, it does mean that performance will depend more heavily on how well optimized a page is for engaged time after publication. This data also allows you to benchmark your articles of various lengths against our global averages.
Decoding the Binned Scatterplot
Since we frequently use bar and line graphs in our research presentations, it’s worth pausing here to explain the graphic above. Rather than plotting millions of articles on one graph, the binned scatterplot uses one dot to represent the Average Engaged Time of all the articles published at a given word count. For dots that are intersected by a line, this denotes the expected range of engaged time for an article of that length. From 0 to 2,000 words, the variation is only hundredths of a second and the dot is essentially also the line. Around 10,000 words, the range visibly stretches to almost 9 seconds.
If we look at the 6,000 word mark as an actual example on the graph, the dot tells us that the Average Engaged Time for all articles of 6,000 words is 80 seconds. The line through the dot then shows us that the least engaging articles of 6,000 words receive about 77 seconds of engaged time, and the most engaging receive about 83 seconds.
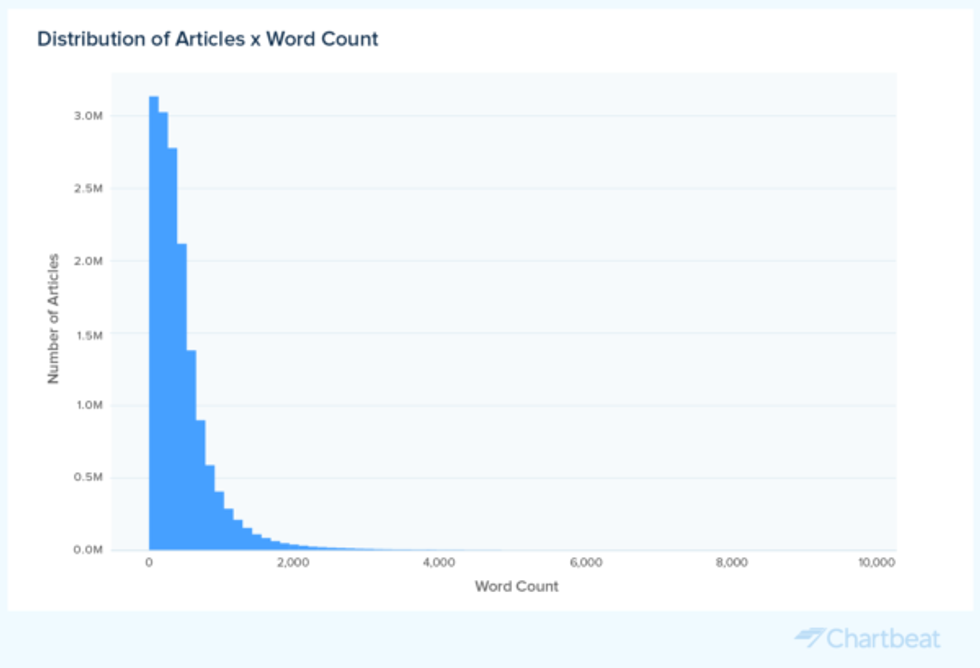
The Majority of Articles in Our Network Are Far Less Than 2,000 Words
 Chartbeat
After discovering that articles between 2,000 and 4,000 words get more engagement than shorter articles, we wanted to see what proportion of total articles fall in this range. Not only did very few articles register more than 2,000 words, but the majority of articles came in at fewer than 500 words.
While the Average Engaged Time for 500 word articles is in line with recent global engagement benchmarks, the difference between a 500 word article and a 2,000 word article is nearly 30 seconds of engaged time.
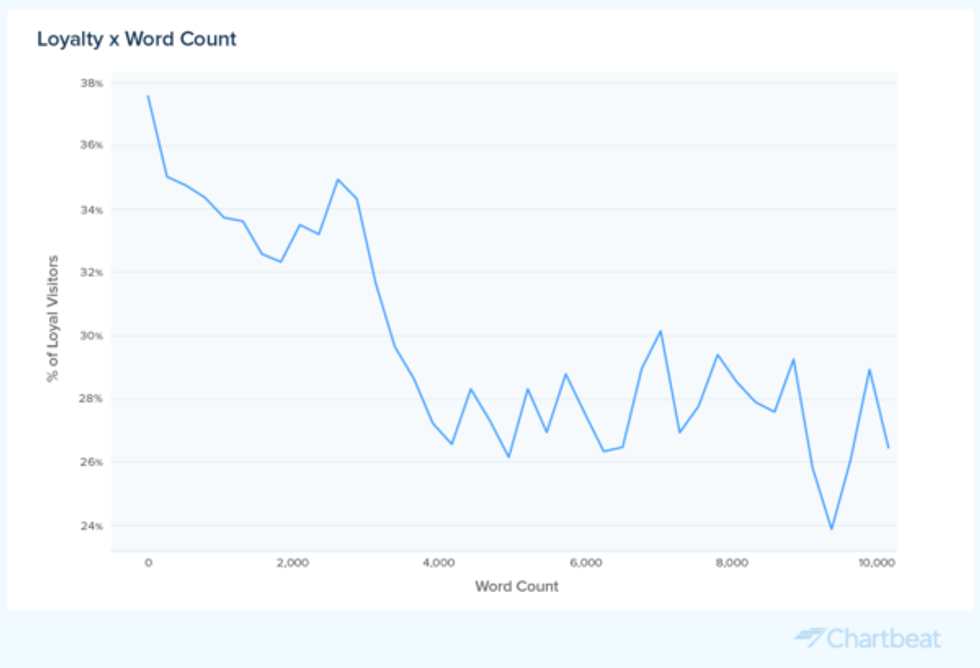
Word Count and Engagement by Loyalty
Since engaged time is a strong indicator of loyalty, we also looked at this data by visitor type. We found that the average percentage of loyal readers, or readers who have visited a site at least 8 of the last 16 days, is highest on articles of 2,500 words or fewer.
 Chartbeat
We’ve previously found that loyal readers tend to read more pages per visit but spend less time on individual pages, so it’s not surprising that longer articles would see more new and returning visitors.
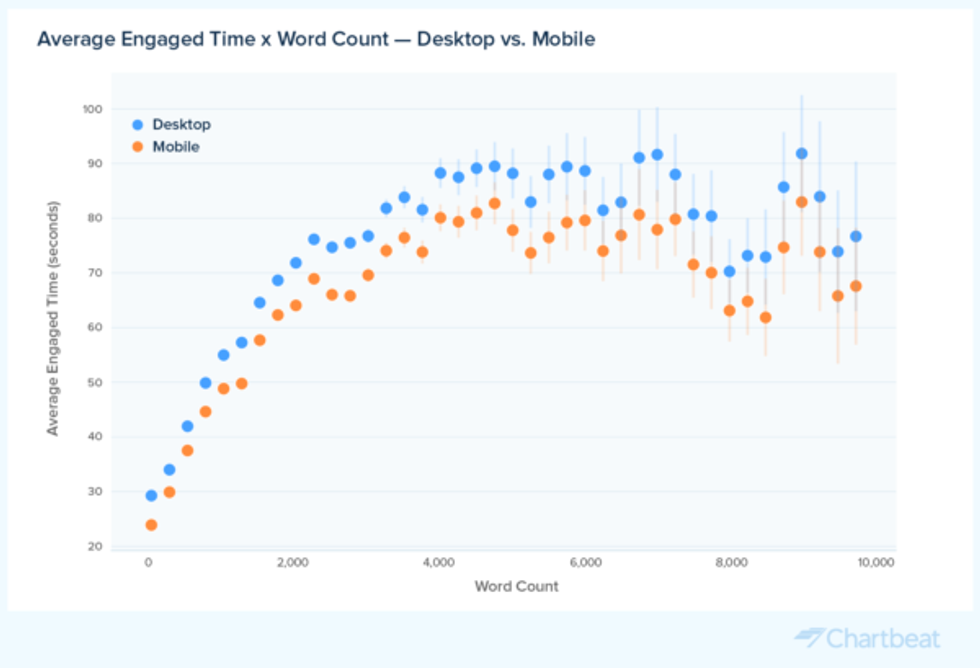
Word Count and Engagement by Device Type
When we look at word count and engagement by device type, we see that the crest of Average Engaged Time for both devices occurs around the same word count as the larger study.
 Chartbeat
Though mobile referrals generate more pageviews than desktop, they haven’t quite caught up when it comes to engagement. As the graph shows, this doesn’t mean that readers aren’t willing to read longer articles on mobile, and engagement strategies should be mindful of the different experiences by device as you execute your optimization strategy.
Using This Data to Optimize Your Content
As you incorporate these findings into the other data and experiences informing your audience engagement strategy, remember that curation and optimization – not word count – will ultimately dictate how much of your content gets consumed. These benchmarks are an additional tool for diagnosing article performance, and when used with real-time analytics, can make your content more engaging before and after publication.
Here are our key takeaways from the research:
1. Between 0 and 2,000 words, Average Engaged Time increases as word count increases.
Our analysis shows that up to almost 4,000 words, the longer article, the more engaging it will be. If your articles are falling short of the benchmarks we’ve shared, a real-time optimization tool like our Heads Up Display can show you how far readers are scrolling and give you an opportunity to make changes at the point of exit.
2. Beyond 4,000 words, variability in engaged time grows, but that doesn’t mean there’s a ceiling.
As we see with our year-end list of the most engaging stories, unique topics can require more depth than daily reporting. This doesn’t mean you should shy away from covering them. It just means you’ll need to devote more attention to optimizing these pages for engaged time.
3. The majority of articles published across our network are less than 500 words.
Not every story can fit snugly between 2,000 and 4,000 words, and we’re not suggesting they should. Articles of all lengths have their place in your content strategy, and can be used together to increase recirculation and engagement. For example, if a brief piece of breaking news goes viral via Search, use well-placed links to drive that traffic further into your site to more engaging articles on similar topics.
4. Engagement should be evaluated on all types of content.
Even after all of our reporting on the way Average Engaged Time increases as word count increases, this article totals only about 1,300 words. If we had additional data and insights that added value, we would gladly include them and expect to further engage our readers. Since we do not, in the days after publication we’ll be monitoring our Historical Dashboard to see if it’s generating around a minute of Average Engaged Time, the benchmark for articles of similar length.
Want more data to fuel your content strategy? Check out more insights from Chartbeat that shows engagement time is increasing despite dips in web traffic overall.
Ready to make the most of modern publishing? Request a proposal to take your website to the next level with RebelMouse.


