

This article was originally posted on the Chartbeat blog. Chartbeat’s real-time content analytics, historical dashboards, and optimization tools help the world’s leading media organizations understand, measure, and build business value from their content.
The 80-20 Rule, also known as the Pareto Principle, is the idea that roughly 80% of results come from 20% of efforts. In practice, this might take the form of a farm where 80% of vegetables come from just 20% of crops or a business where 20% of customers account for 80% of revenue. No matter the industry, the actual ratio is less instructive than the idea that some efforts drive more value than others and identifying those value drivers can increase efficiency and productivity.
When it comes to publishing, identifying the articles that drive the lion’s share of readership has obvious benefits. Armed with this information, publishers could not only replicate the kind of content that leads to ROI, but they could also use optimization tools to apply the successful traits of that segment to the long tail of content that has a smaller audience.
To determine how closely the publishing world adheres to the 80-20 rule, our Data Science team analyzed thousands of websites from more than 70 countries to understand what percent of articles drive the majority of pageviews and how the ratio might vary by factors like site size and subject matter. Here’s what we learned.
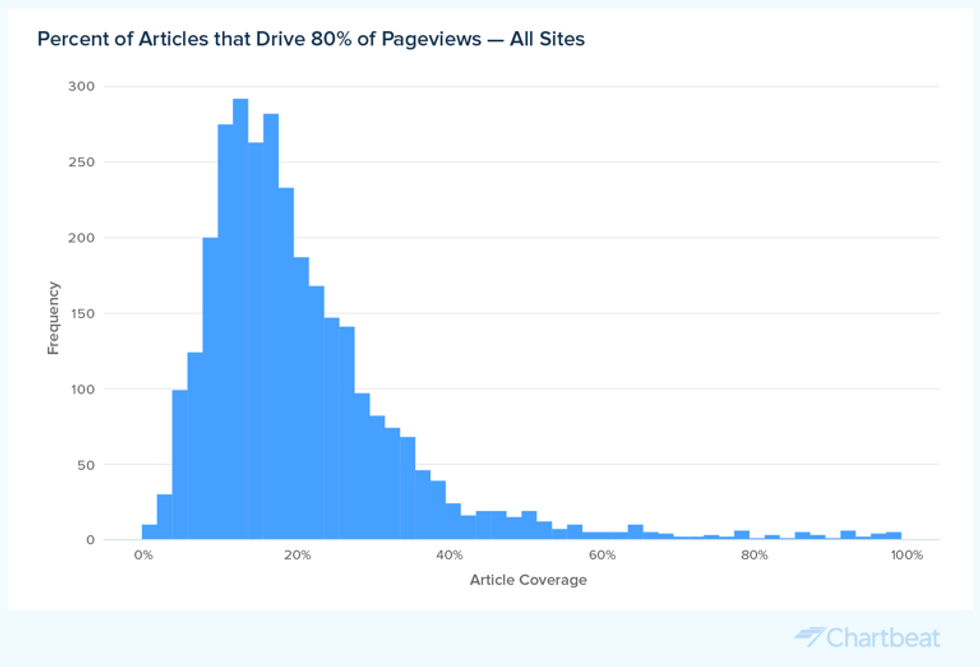
80% of Pageviews Come From 20% (or Less) of Content
 Chartbeat
With all of our research, having a large network of global partners is hugely beneficial. More important than access to the raw data, though, is knowing how to control and parse it. With this analysis in particular, if we don’t control for site size, the findings skew toward the behavior of larger sites and obscure a true reading of small and medium-sized publishers.
For example, if we look at our network as a whole from January 2022 through September 2022, we find that 80% of pageviews come from a mere 6% of articles. When we group our findings by host, however, we see that most sites get 80% of their pageviews from 20% of their articles or less. Across all hosts, the average is 21%. The difference in these two readings provides our first clue that the larger a site is, the more concentrated its pageviews will be in its top-performing articles.
Comparing Pageviews and Engagement
As readers of the Chartbeat blog well know, pageviews are but one metric to include in a content optimization strategy. For additional context, we also examined the distribution of Engaged Time across our network. We found that engagement is even more concentrated at the top than pageviews. In fact, the same 20% of articles account for over 90% of Engaged Time.
How Page View Coverage Differs by Size of Site
As we alluded to earlier, as sites get larger, the percentage of articles that account for the majority of pageviews gets smaller. To more closely examine this trend at multiple audience sizes, we’ve partitioned our research into four categories. Tiny is any site with less than 1,000 pageviews per day, Small is any site with 1,000–10,000 pageviews per day, Medium is any site with 10,000–100,000 pageviews per day, and Large is any site with over 100,000 pageviews per day.
As we see in the graph above, the largest sites require fewer articles to drive the majority of their traffic. Large sites get 80% of their pageviews from only 14% of articles while Tiny sites spread the same percent of traffic across 35% of articles. For Small sites, it’s 27%, and Medium sites average 21%. This reinforces the notion that while larger sites can leverage a few viral articles for significant traffic, smaller sites have to rely on a wider breadth of content to do the same.
How Page View Coverage Differs by Subject Matter
In addition to site size, we also examined subject matter’s influence on page view concentration. As a reminder, when we looked at all site categories in our network, we found that 80% of pageviews are generated by an average of 21% of articles. When we drill down into a few individual categories, we find that pageviews are concentrated in a slightly smaller percentage of articles.
For News and Media, 20% of articles contribute 80% of pageviews. For Sports and Finance, it’s 19%, and for Arts and Entertainment, it’s 18%. As subject matters get more niche, there’s a little more concentration of pageviews, but it doesn’t stray too far from the 80-20 trend.
Pageviews by Country
Like site size and subject matter, we also wanted to see how breadth of content varies by country. Note that country refers to the country of the reader rather than the publisher.
When broken out geographically, we find that some nations like India, Brazil, and Spain underperform the 20% level while others like the United Kingdom and Australia have more breadth of readership at 25.8% and 22.1%, respectively. For regions well below the 20% threshold, there’s an even bigger opportunity to optimize underperforming content.
Using the 80-20 Rule to Evaluate Your Own Content
When the average website gets 80% of total pageviews from 20% of their articles, one could make the argument that there’s too much content and too little time to read it all. While that may be true on the scale of our global network, there’s more nuance and opportunity for individual websites.
The right balance of action will vary from site to site, but there are a few avenues every publisher should explore. One is deprioritizing less popular topics in order to spend more time and resources on a fewer amount of high-impact articles. Adherents of the 80-20 rule point to increased efficiency and productivity as a main benefit of using the framework.
The other option is diagnosing and optimizing the shortcomings of the content in the underperforming segment. In either scenario, real-time and historical analytics provide necessary insight to help identify the types of content to invest in and then measure the success of those efforts.
Cynthia Vu of Chartbeat’s Data Science team contributed research to this article.


