Core Web Vitals (CWV) are a critical element for a successful web site. The RebelMouse CMS is built around the idea that your site should pass CWV without needing a huge lift from a development team. In fact, many of the fastest sites on the web, and best performing at CWV, are powered by RebelMouse.
One very tricky aspect to achieving success at CWV though, is built into the standard testing tools, namely Google’s PageSpeed Insights test. PageSpeed Insights gives you a very nice snapshot into your site’s performance, but it’s designed to show a 28-day average of your performance. This means that whenever you make a big performance update to your site, it’s going to be nearly a month until you know if your update helped or hurt your site.
At RebelMouse, we believe that you shouldn’t have to wait to know what’s happening to your site. That’s why we've launched RebelMouse Performance Monitoring. With this powerful tool, you can see your CWV performance in real time, and measure your performance against your traffic.
What Are Core Web Vitals?
Here's a quick recap of the metrics that make up Google's Core Web Vitals:
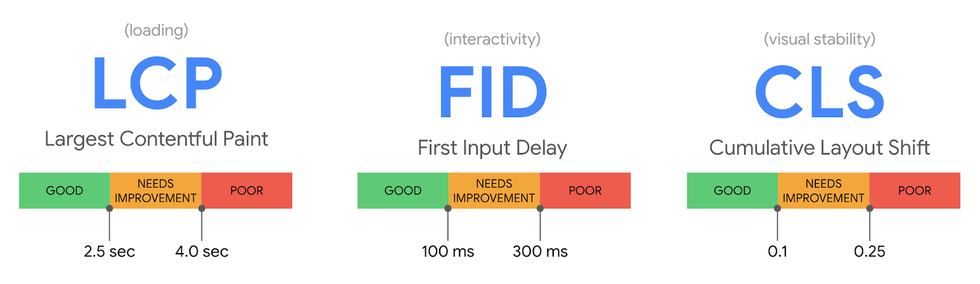
Largest Contentful Paint (LCP): A website's LCP is the time it takes to load the main content on a page. Google wants LCP to happen within 2.5 seconds of when a page first starts loading.
First Input Delay (FID): This metric quantifies a user's experience when trying to interact with unresponsive pages. You want your FID score to be low to prove the usability of your site. According to Google, pages should haven an FID of less than 100 milliseconds.
Cumulative Layout Shift (CLS): CLS determines how often your users experience unexpected layout shifts or changes on a page. To ensure visual stability, you want your CLS score to be low. Google recommends that pages maintain a CLS score of less than 0.1.
The other existing performance-based search signals are:
First Contentful Paint (FCP): This metric measures the time from when the page starts loading to when any part of the page's content is rendered on the screen. For this metric, "content" refers to text, images (including background images), <svg> elements, or non-white <canvas> elements.
Interaction to Next Paint (INP): This is a metric that aims to represent a page's overall interaction latency by selecting one of the single longest interactions that occur when a user visits a page. For pages with less than 50 interactions in total, INP is the interaction with the worst latency. For pages with many interactions, INP is most often the 98th percentile of interaction latency.
Time to First Byte (TTFB): This is a foundational metric for measuring connection setup time and web server responsiveness in both the lab and the field. It helps identify when a web server is too slow to respond to requests. In the case of navigation requests — that is, requests for an HTML document — it precedes every other meaningful loading performance metric.
Transform Your Site's Performance With RebelMouse Performance Monitoring
Monitor Your Site's Core Web Vitals in Real Time
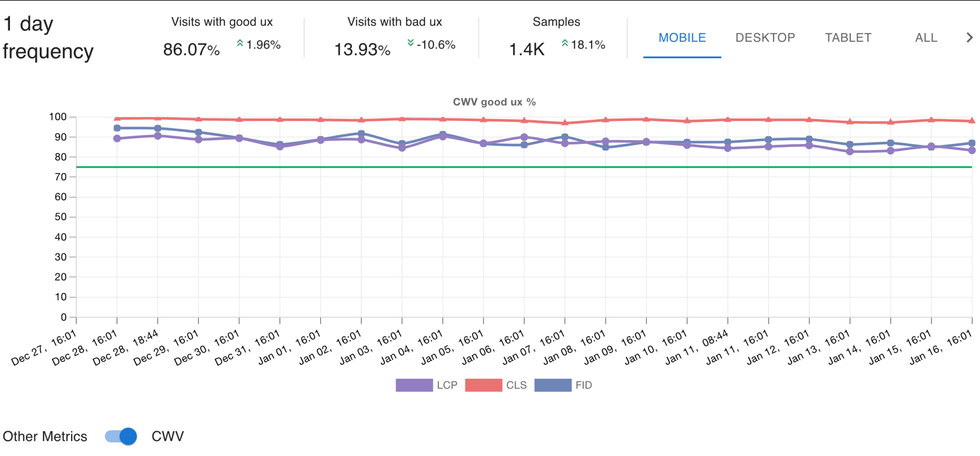
With RebelMouse Performance Monitoring, you can keep track of any page's Core Web Vitals in real time, with updates every five minutes. With instant feedback on your website's LCP, FID, and CLS scores, you can quickly know when something is wrong and make changes to keep your website speed and user experience on the path to success.
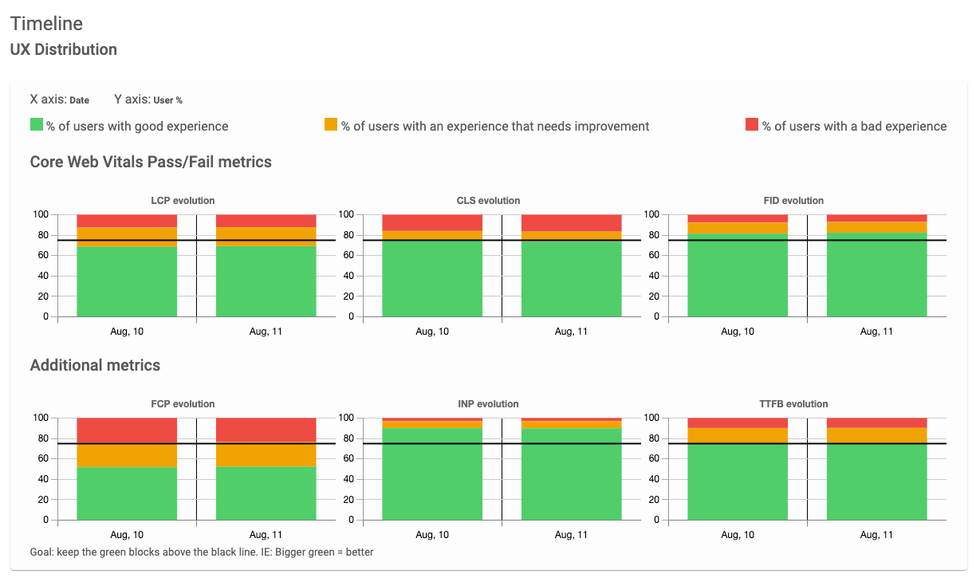
See Your Own Impact: Monitor Specific Dates

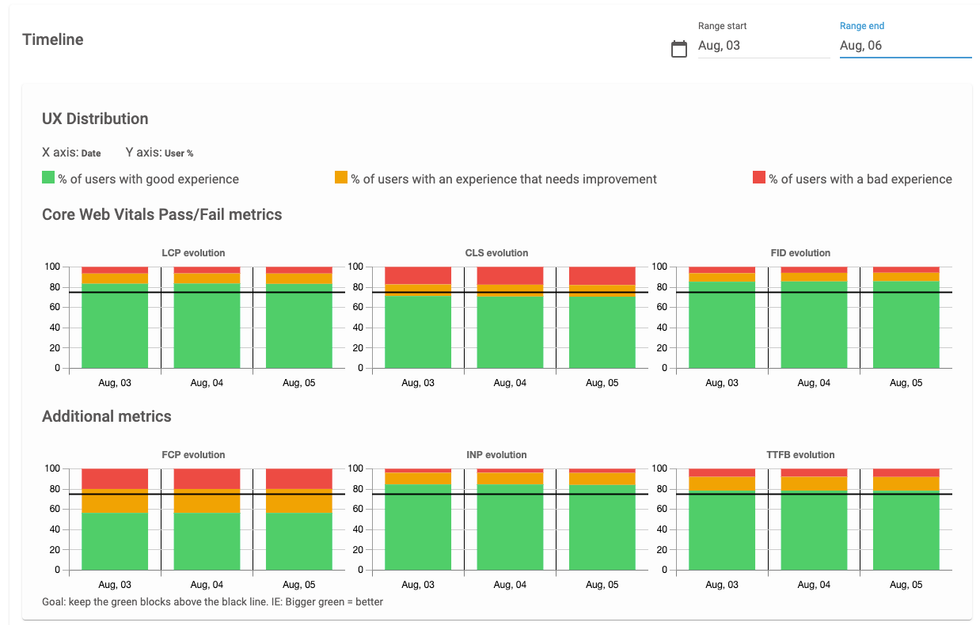
You can also easily select a specific date range to see how your site is performing. This is very valuable when you make a significant update. Let’s suppose that a change is made on August 3. We can wait a couple of days and then select the date range from August 3 through August 6. This allows us to see exactly the effect our updates had on our site:
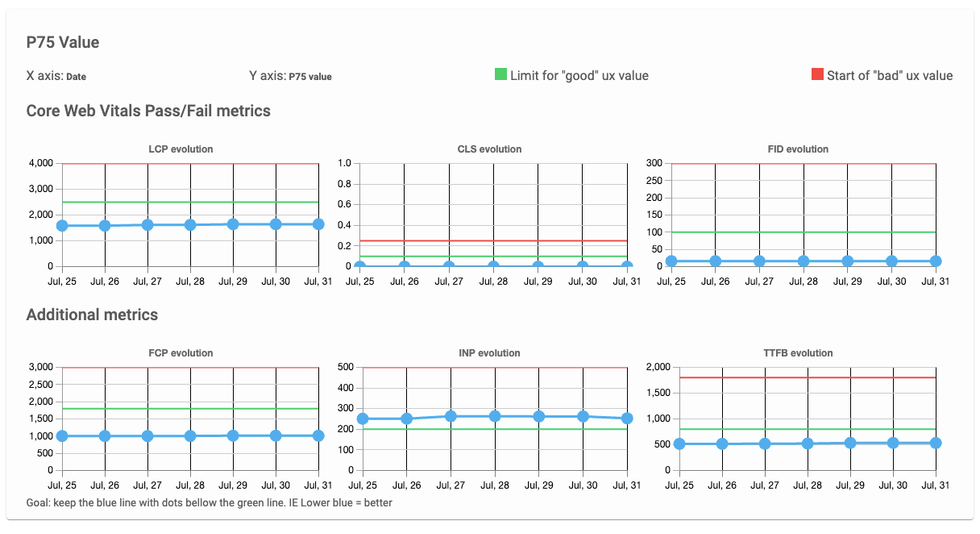
Visualize Your Site's P75 Values
You can also visualize your P75 values through the dashboard. P75 is a very useful metric that allows you to see how 75% of your page loads are performing. Because there are a multitude of reasons that your CWVs could perform differently for different people on different devices (and it’s a virtual impossibility for all visitors to have a perfect site load), this method effectively eliminates the noise and allows for an average score.
Looking at the screenshot below, we can see many things. The red line indicates the point at which a specific CWV metric fails (for instance, 4,000 ms for LCP). The green line indicates the threshold for passing a specific CWV. And, finally, the blue line indicates the performance of your site. The goal is to keep the blue line below the green line, which tells you that 75% of your page loads are passing CWV, which is the ultimate goal. It’s worth noting that there are three levels to passing or failing CWV. The third level is when you fall between the green and the red lines on the graph. This is considered "OK" for CWV, but is still not considered passing.
See How Each Article Scores
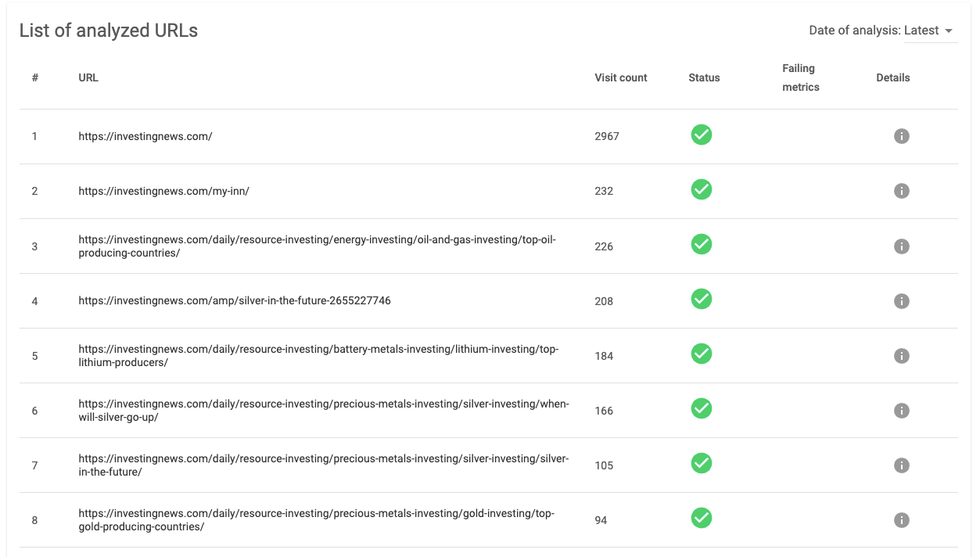
You can also access a list of all the URLs that have been analyzed and get a quick look into which individual articles are passing and which are failing the CWV test. Here we can see a list of top-performing pages and whether they are passing or failing. In this example, we can see that the top-10 pages are either passing or do not have enough data to have a result. It’s great to see that everything is green here, but what if we have a site where everything is not so optimized?
Well, just like we saw in the full site view, we can drill down into the article view and see exactly what the problems are with an individual article. See below for how this looks on a page that has CWV not passing:
Again, we are also able to see this information across a longer time frame if we wish:
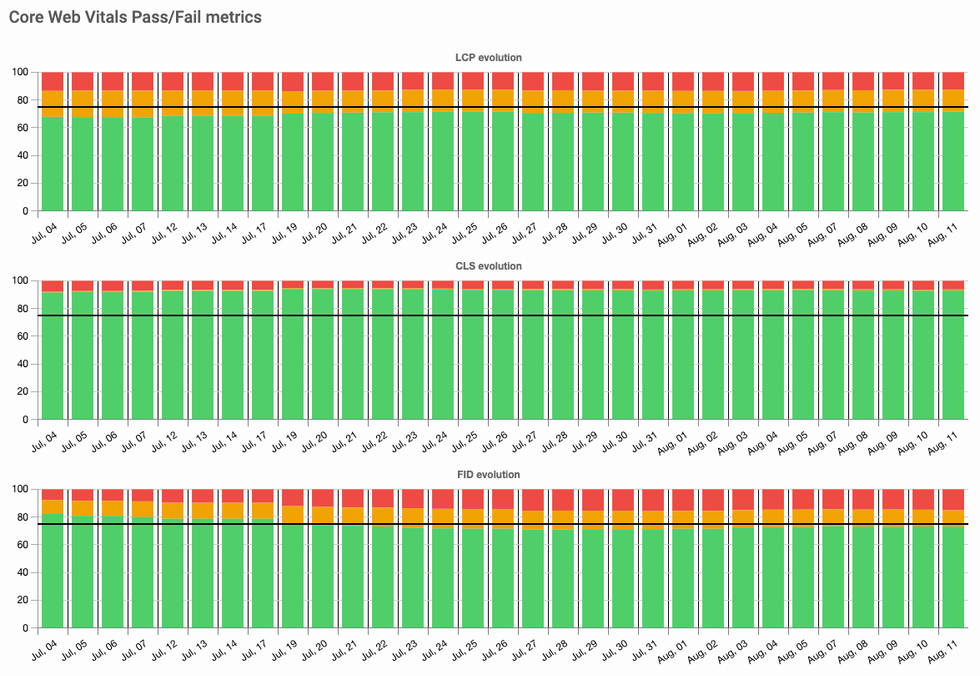
Being able to access this data whenever you make updates to your site will allow you to be sure that your changes have been beneficial virtually instantly. This is incredibly critical, because if you accidentally introduce changes that harm your CWV, you can know now instead of in a month.
Drill Down Into LCP Issues
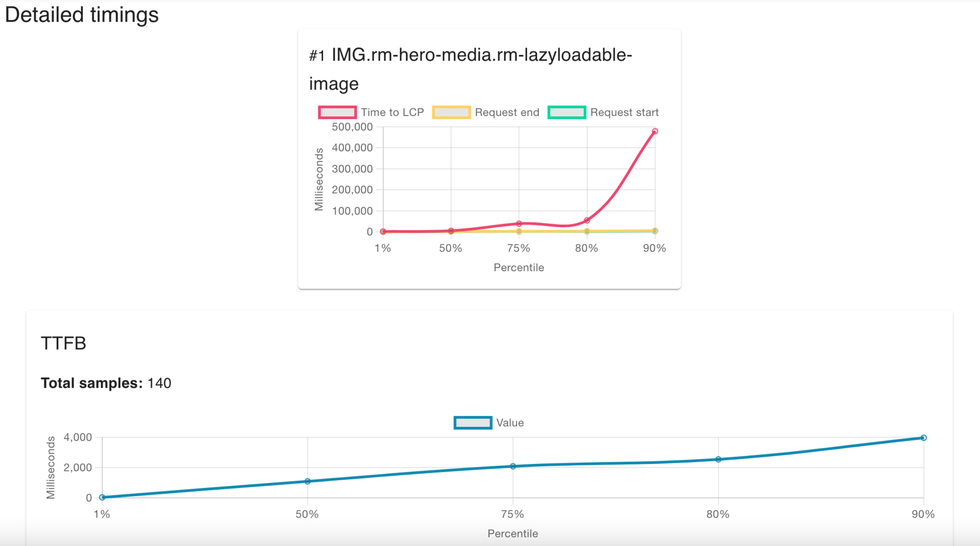
RebelMouse Performance Monitoring also allows you to quickly and easily identify page speed issues related to LCP. With this feature, you can see all of the LCP issues on your site, with a detailed list of images that are causing the problems, as well as the URLs impacted.
Take Your Website Performance to the Next Level
Click here to sign up for RebelMouse Performance Monitoring.
Not on RebelMouse yet? Reach out today to get started.
If you're already on RebelMouse and want to learn more about how we help you manage Core Web Vitals to get the most out of your content, please contact your account manager or our support team and they’ll be happy to assist you.


![Best CMS for News Websites and Large-Scale Publishing [2024]](https://www.rebelmouse.com/media-library/image.png?id=51952819&width=600&height=600&quality=85&coordinates=350%2C0%2C350%2C0)


