

This article was originally posted on the Chartbeat blog. Chartbeat’s real-time content analytics, historical dashboards, and optimization tools help the world’s leading media organizations understand, measure, and build business value from their content.
In the hierarchy of traffic and readership, pageviews and new visitors are good, but sustained engagement and subscribers are better. After analyzing traffic, engagement, and loyalty trends across the entire Chartbeat network earlier this year, we’ve drilled down on subscribers to see how they find content, how often they visit, and what topics keep them engaged.
What We Know About Subscriber Traffic, Engagement, and Loyalty
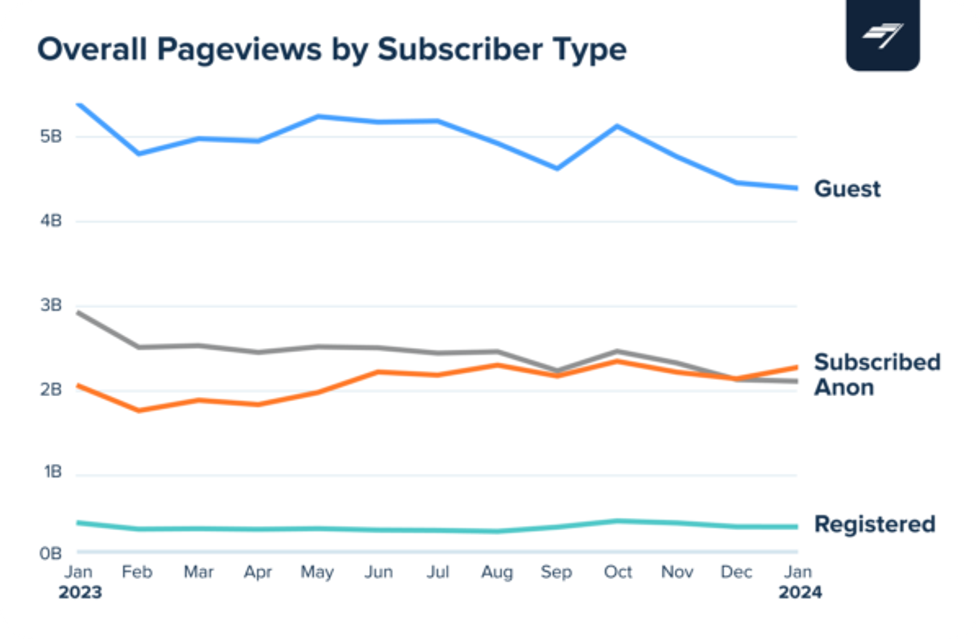
Across all visitors, we saw traffic grow from 48 billion average monthly pageviews in 2022 to 54 billion in 2023. Subscriber pageviews also grew last year, increasing more than 10% from January 2023 to January 2024.
 Chartbeat
Though subscriber pageviews increased, the percentage of subscribers remained steady, indicating more pageviews per subscriber as the year went on. Guest, registered, and anonymous visitors, on the other hand, all decreased in pageviews.
Subscriber Engagement
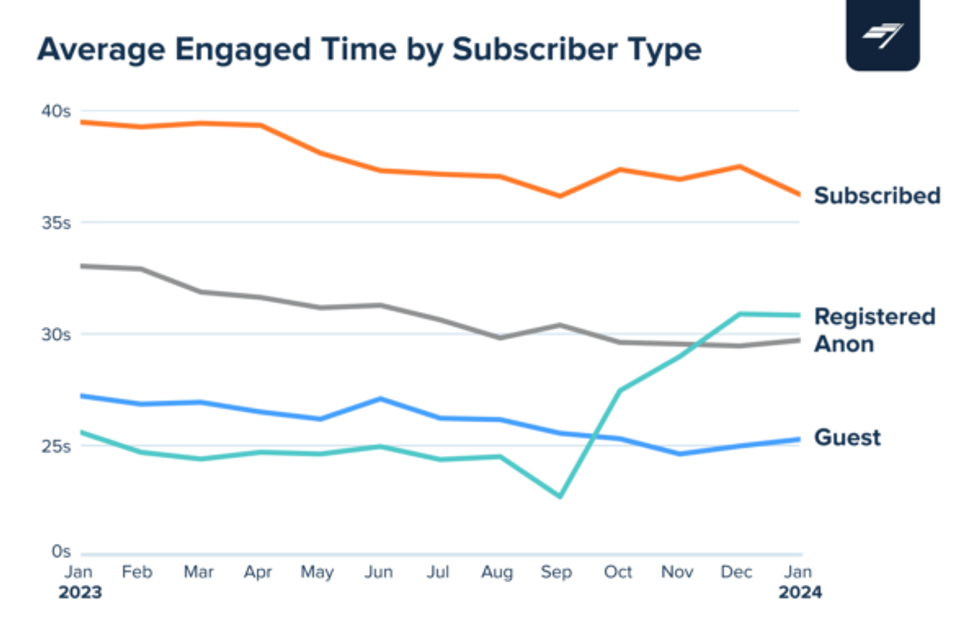
Across the network last year, readers engaged for an average of 28.1 seconds. Subscribers, meanwhile, engaged for 37.8 seconds, the highest average engaged time per pageview of the groups below.
 Chartbeat
Throughout the year, it’s common to see average engaged time decrease from a high in the first quarter. In 2023, registered users reversed this trend by increasing their average engaged time by eight seconds from September to December. This was driven by high engagement from visitors referred by deep links and push alerts.
Comparing Loyalty and Subscriber Type
We can’t talk about subscriptions without talking about loyalty. At Chartbeat, we categorize frequency of visits into three buckets — new, returning, and loyal. New visitors come to a site only once per 30 days while loyal visitors come back at least every other day. While this may seem like a high bar for loyalty, research shows that visitor behavior changes materially once meeting this threshold.
 Chartbeat
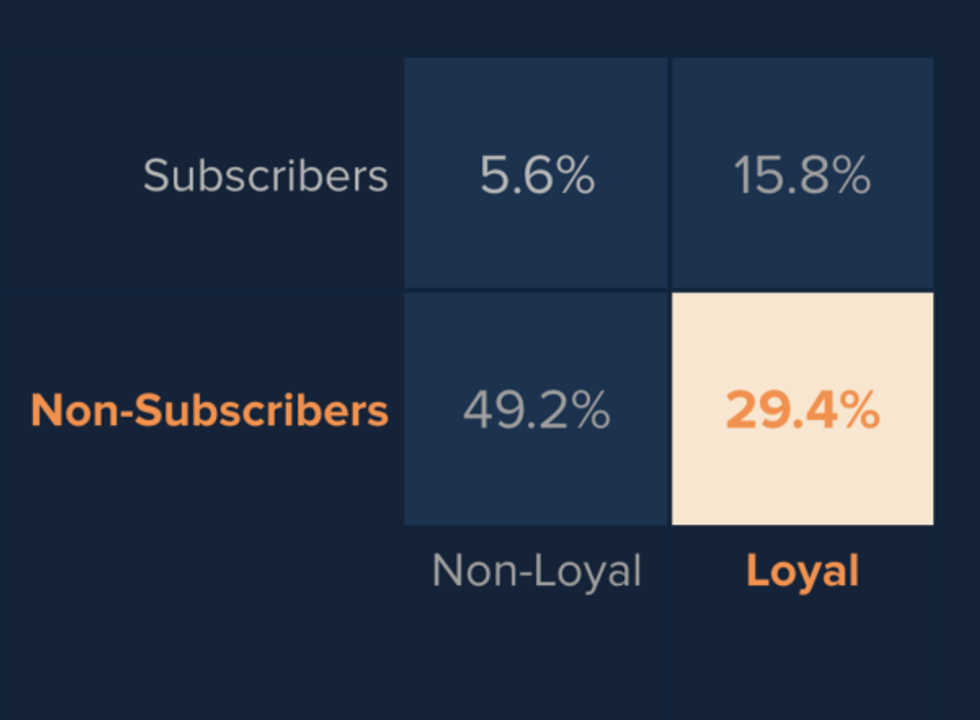
When we apply subscription status to loyalty, we find that the majority of visitors are neither subscribed nor loyal. This group accounts for 49.2% of pageviews.
The next largest group is loyal non-subscribers. At 29.4% of pageviews, they represent the best revenue opportunity as they are already exhibiting subscriber-like behavior.
The smallest population is non-loyal subscribers which account for 5.6% of pageviews. While this group is small, it must be noted that subscribers who are not visiting as often as they once did are at risk of churning.
How Subscribers Find Content
 Chartbeat
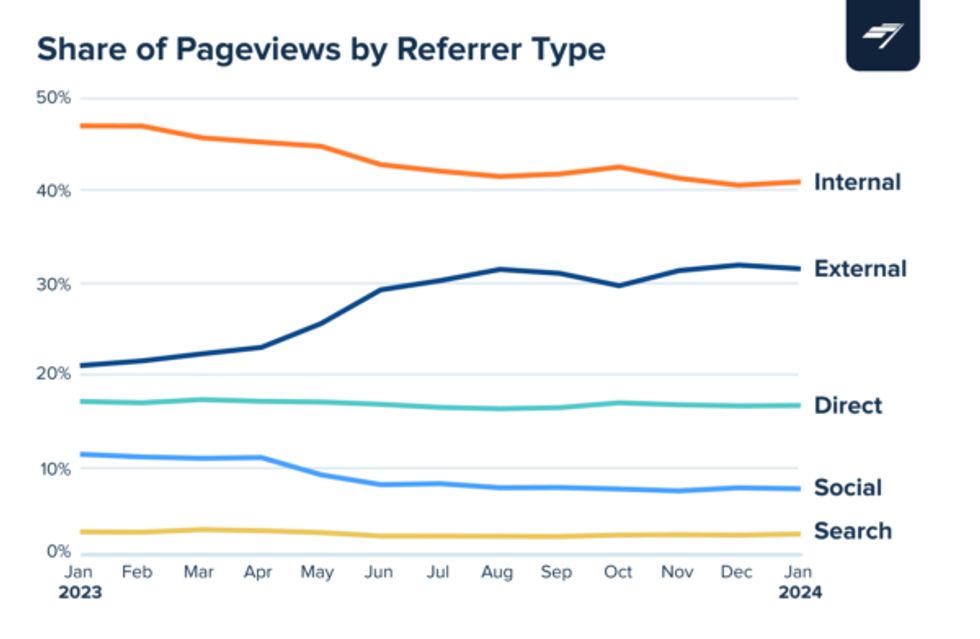
As with the network as a whole, subscribers are most often referred internally. When they’re coming from off-site channels, their path is typically direct or via an external source such as push alerts. Because of this, search engines and social media platforms are much less significant to this group.
 Chartbeat
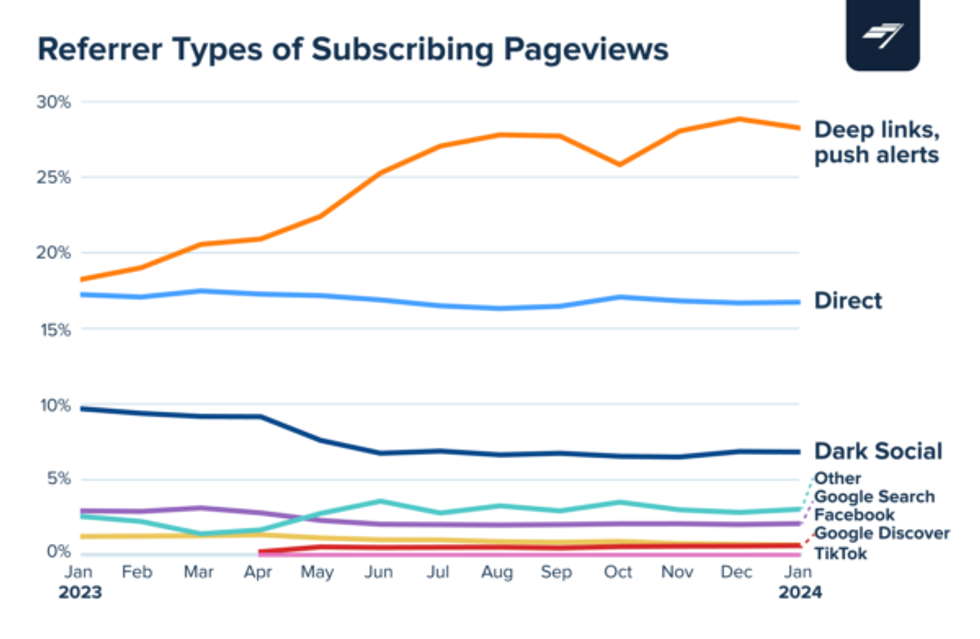
Looking closer, we see that deep links and push alerts are the biggest external referral sources for subscribers, accounting for roughly 25% of their pageviews in 2023. Direct traffic, the next biggest referrer, remained steady at around 17%.
 Chartbeat
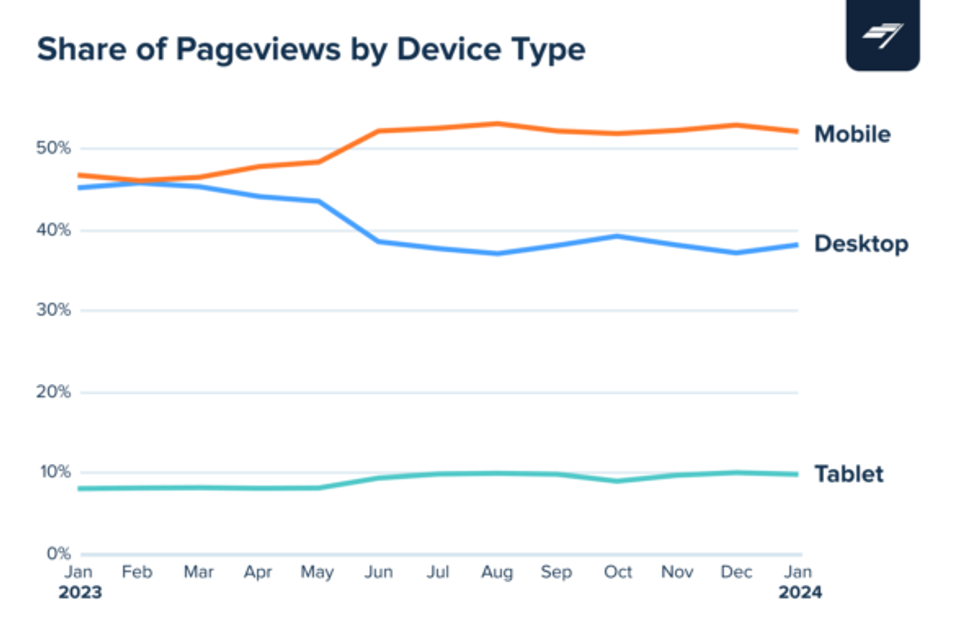
When it comes to device usage, subscribers use phones more often than a desktop or tablet, but at a much lower rate than the network average of 72%. When we break down mobile traffic between app and mobile web browsers, it’s a relatively even split with app traffic slightly higher at 55%.
The Topics Engaging Subscribers
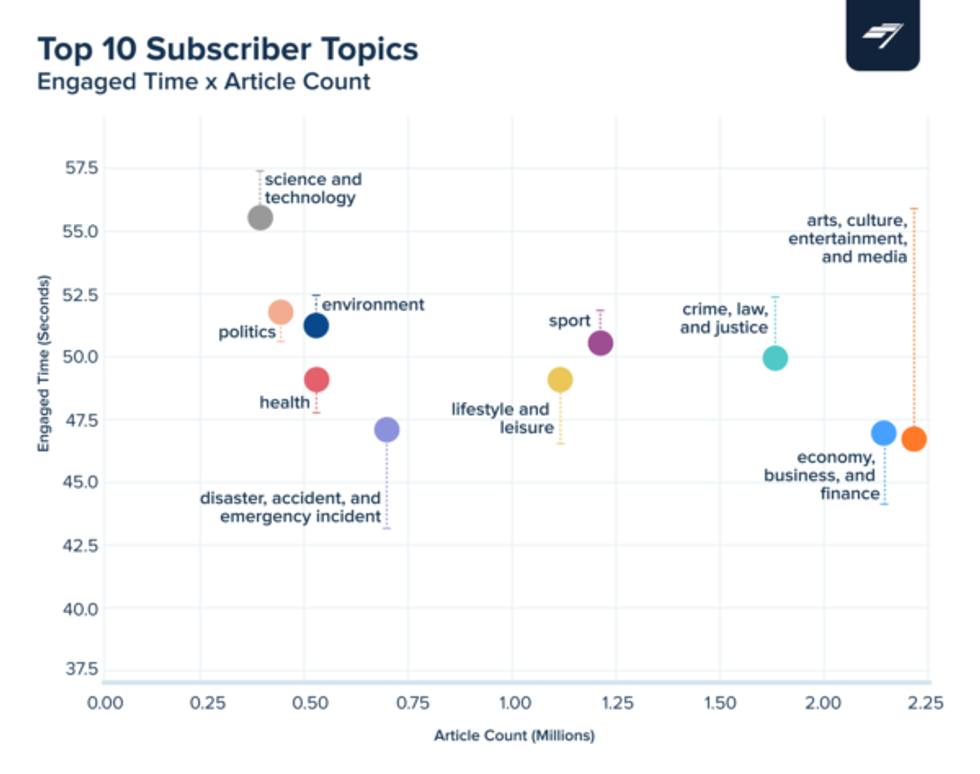
In previous research on breadth of readership, we found that the most popular categories were “crime, law, and justice” and “economy, business, and finance.” While these two are also popular among subscribers, the top subscriber category by pageviews is “arts, culture, entertainment, and media.”
 Chartbeat
The top categories by average engaged time are science and tech, politics, and environment. These topics land in the top-left quadrant of our scatterplot where high demand (engaged time) and low supply (article count) intersect, indicating an opportunity to fill a gap for an engaged audience.
Key Takeaways From Our Subscriber Analysis
Though subscribers comprise a smaller percentage of total traffic, they read more articles per month and engage longer with each article. They’re invested in the content you produce today as well as the content you’re working on tomorrow. To better serve and engage this key group, here are three key takeaways from our research:
- Across the Chartbeat network, 72% of site visits occur on mobile. With subscribers it’s closer to 50%.
- 29% of pageviews come from loyal visitors who aren’t subscribers…yet.
- Topics with high engaged time and low article count offer an opportunity to reach niche audiences.
Ready to make the most of modern publishing? Request a proposal to take your website to the next level with RebelMouse.


