

Key Takeaways
Real time data drives editorial decisions:
It lets teams promote a trending story or reposition content on the homepage, decisions that yesterday's analytics cannot support.Most analytics tools sit outside the workflow:
They are expensive, require separate logins, and are disconnected from the content workflow, which reduces their practical value for editorial teams.The Stats Dashboard is built into the platform:
It is built directly into RebelMouse and updates every 15 seconds in 20 minute data chunks, eliminating the need for a separate analytics tool.It covers the views editors need:
Daily, weekly, and monthly views with previous session comparisons, individual article stats, content filters, and traffic source breakdowns.Data where content is created:
Having real time data in the same place content is created removes workflow friction and enables faster, data informed publishing decisions.
Size might not matter, but timing surely does. That's why you need to know what's happening with the traffic on your site right now — not just what was happening yesterday.
Every decision you make, from editorial to article placements on your home page to when and how you push to social to breaking news coverage, should be informed by data. With the pace of the modern media landscape, having insight into your traffic, content performance, and comparisons between now and then is critical.
Consider a potential workflow for a modern newsroom:
- Look at the data in your analytics platform to see hot times on your website over the past month.
- Check Google Search Console to see when people are searching for specific terms.
- Set up an editorial calendar to publish articles at the right time, according to the data.
- Sit back and hope that this week has the same patterns as last week.
Most real-time analytics tools are standalone products, either bolted onto a CMS or completely separated from it. This has significant drag on budgets, workflow, and even efficiency. Consider the following points about your typical analytics tools. They are:
- Expensive.
- Separated from the content workflow and require separate logins.
- Training, maintenance, and administratively intensive.
- Underused, not well understood, and probably a mystery to most of your team.
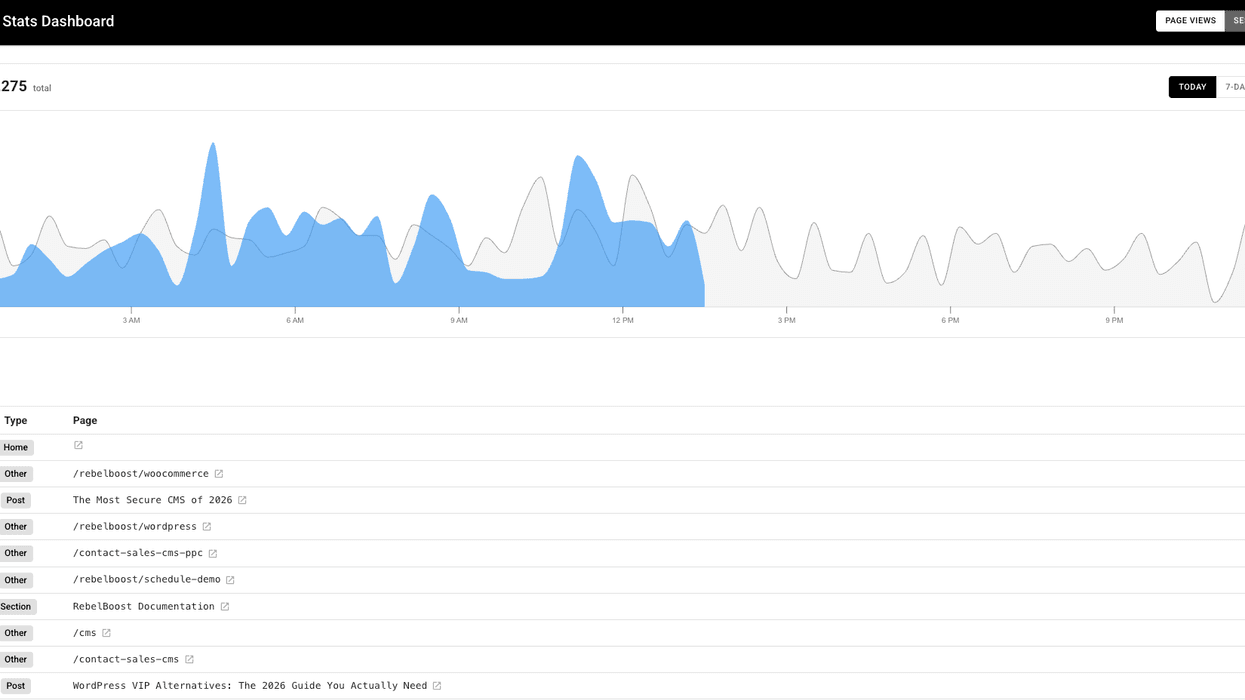
RebelMouse's new Stats Dashboard is now available as an upgrade from our standard data tracking. The dashboard can be accessed direction from the main platform menu, and it provides you with visibility into what's happening on your site right now. The features include:
- Daily, weekly, and monthly views, with previous-session comparisons.
- 15-second updates, and 20-minute data chunks.
- Real-time listings of individual article stats.
- Content filters.
- Traffic source breakdowns.
- Is a new story starting to take off? You can see that happening live and begin to promote it to your highest-performing channels.
- Is last week's clunker starting to gain traction? You can see that happening live and move it back up to the top of your home page.
- Have a breaking news story? Watch how its traffic evolves as the story develops.
By having the data you need in the same place you create your content, you can now publish and track without the need for any additional tools or channels.
We believe in a world where all of the functionality you need is at your fingertips, built by the team you know.
What is a real-time traffic monitoring dashboard?
A real-time traffic monitoring dashboard is an analytics tool that shows live website performance data — including active visitors, page views, traffic sources, and individual article stats — updated continuously rather than on a 24-hour delay. It allows editorial and marketing teams to make decisions based on what is happening now, not what happened yesterday.
How is RebelMouse's Stats Dashboard different from Google Analytics
RebelMouse's Stats Dashboard is built directly into the CMS, meaning editors can monitor traffic and act on it — moving content, promoting articles, or adjusting social distribution — without switching tools or logging into a separate platform. Most standalone analytics tools, including Google Analytics, require a separate interface and login, creating friction in the editorial workflow.
How often does RebelMouse's Stats Dashboard update?
The dashboard updates every 15 seconds and displays data in 20-minute chunks, giving editorial teams a near-live view of content performance across daily, weekly, and monthly timeframes.
What decisions can a real-time dashboard improve for a newsroom?
Real-time dashboards help newsrooms identify which stories are gaining traction so they can be promoted immediately, spot underperforming content before it wastes homepage real estate, track breaking news traffic as a story develops, and time social distribution to match peak audience activity rather than relying on historical patterns.
Does RebelMouse's Stats Dashboard replace a dedicated analytics platform?
For most editorial use cases — traffic monitoring, content performance tracking, and source breakdowns — yes. It is designed to give teams the data they need within the publishing workflow without the cost, training overhead, and administrative burden of a separate analytics subscription.


